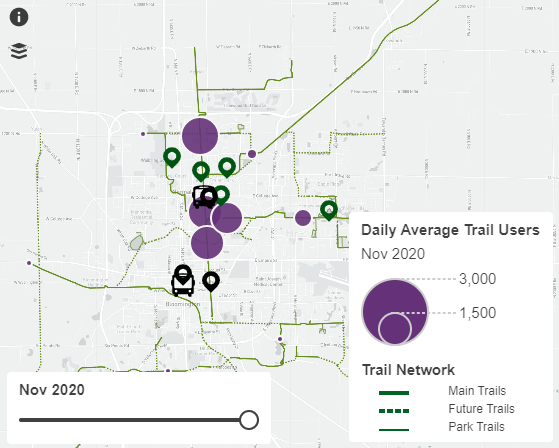
BN Active Transportation Guide
Leaflet.js web map application which displays bike and pedestrian count information alongside trail network and point of interest data.
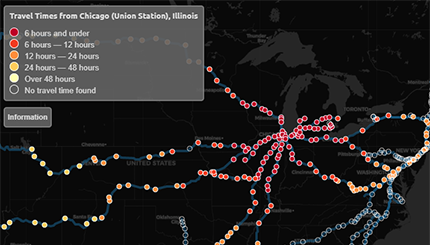
Amtrak Explorer
Leaflet.js web map application which displays minimum travel times between Amtrak Stations, derived from a GTFS file processed in R using tidytransit.
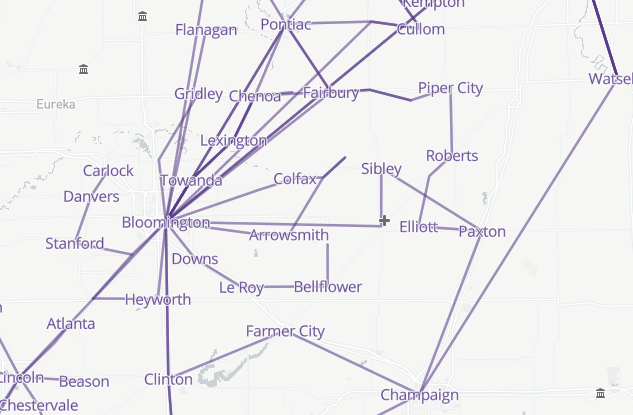
Rural Transportation
A visualization of an on-demand rural transportation network, constructed from schedule information using QGIS and incorporated into a Mapbox tileset.
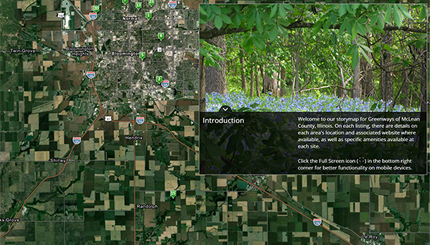
Greenways of McLean County
ArcGIS Story Map exploration of parks, trails, and other green recreation areas in McLean County, Illinois.
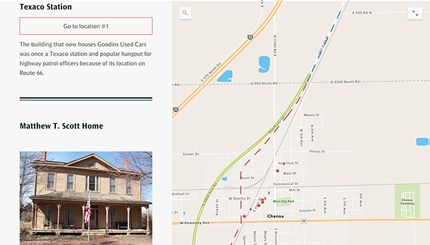
Route 66 in McLean County
Collection of historical photos, site information, and location data, presented using ArcGIS Story Maps.
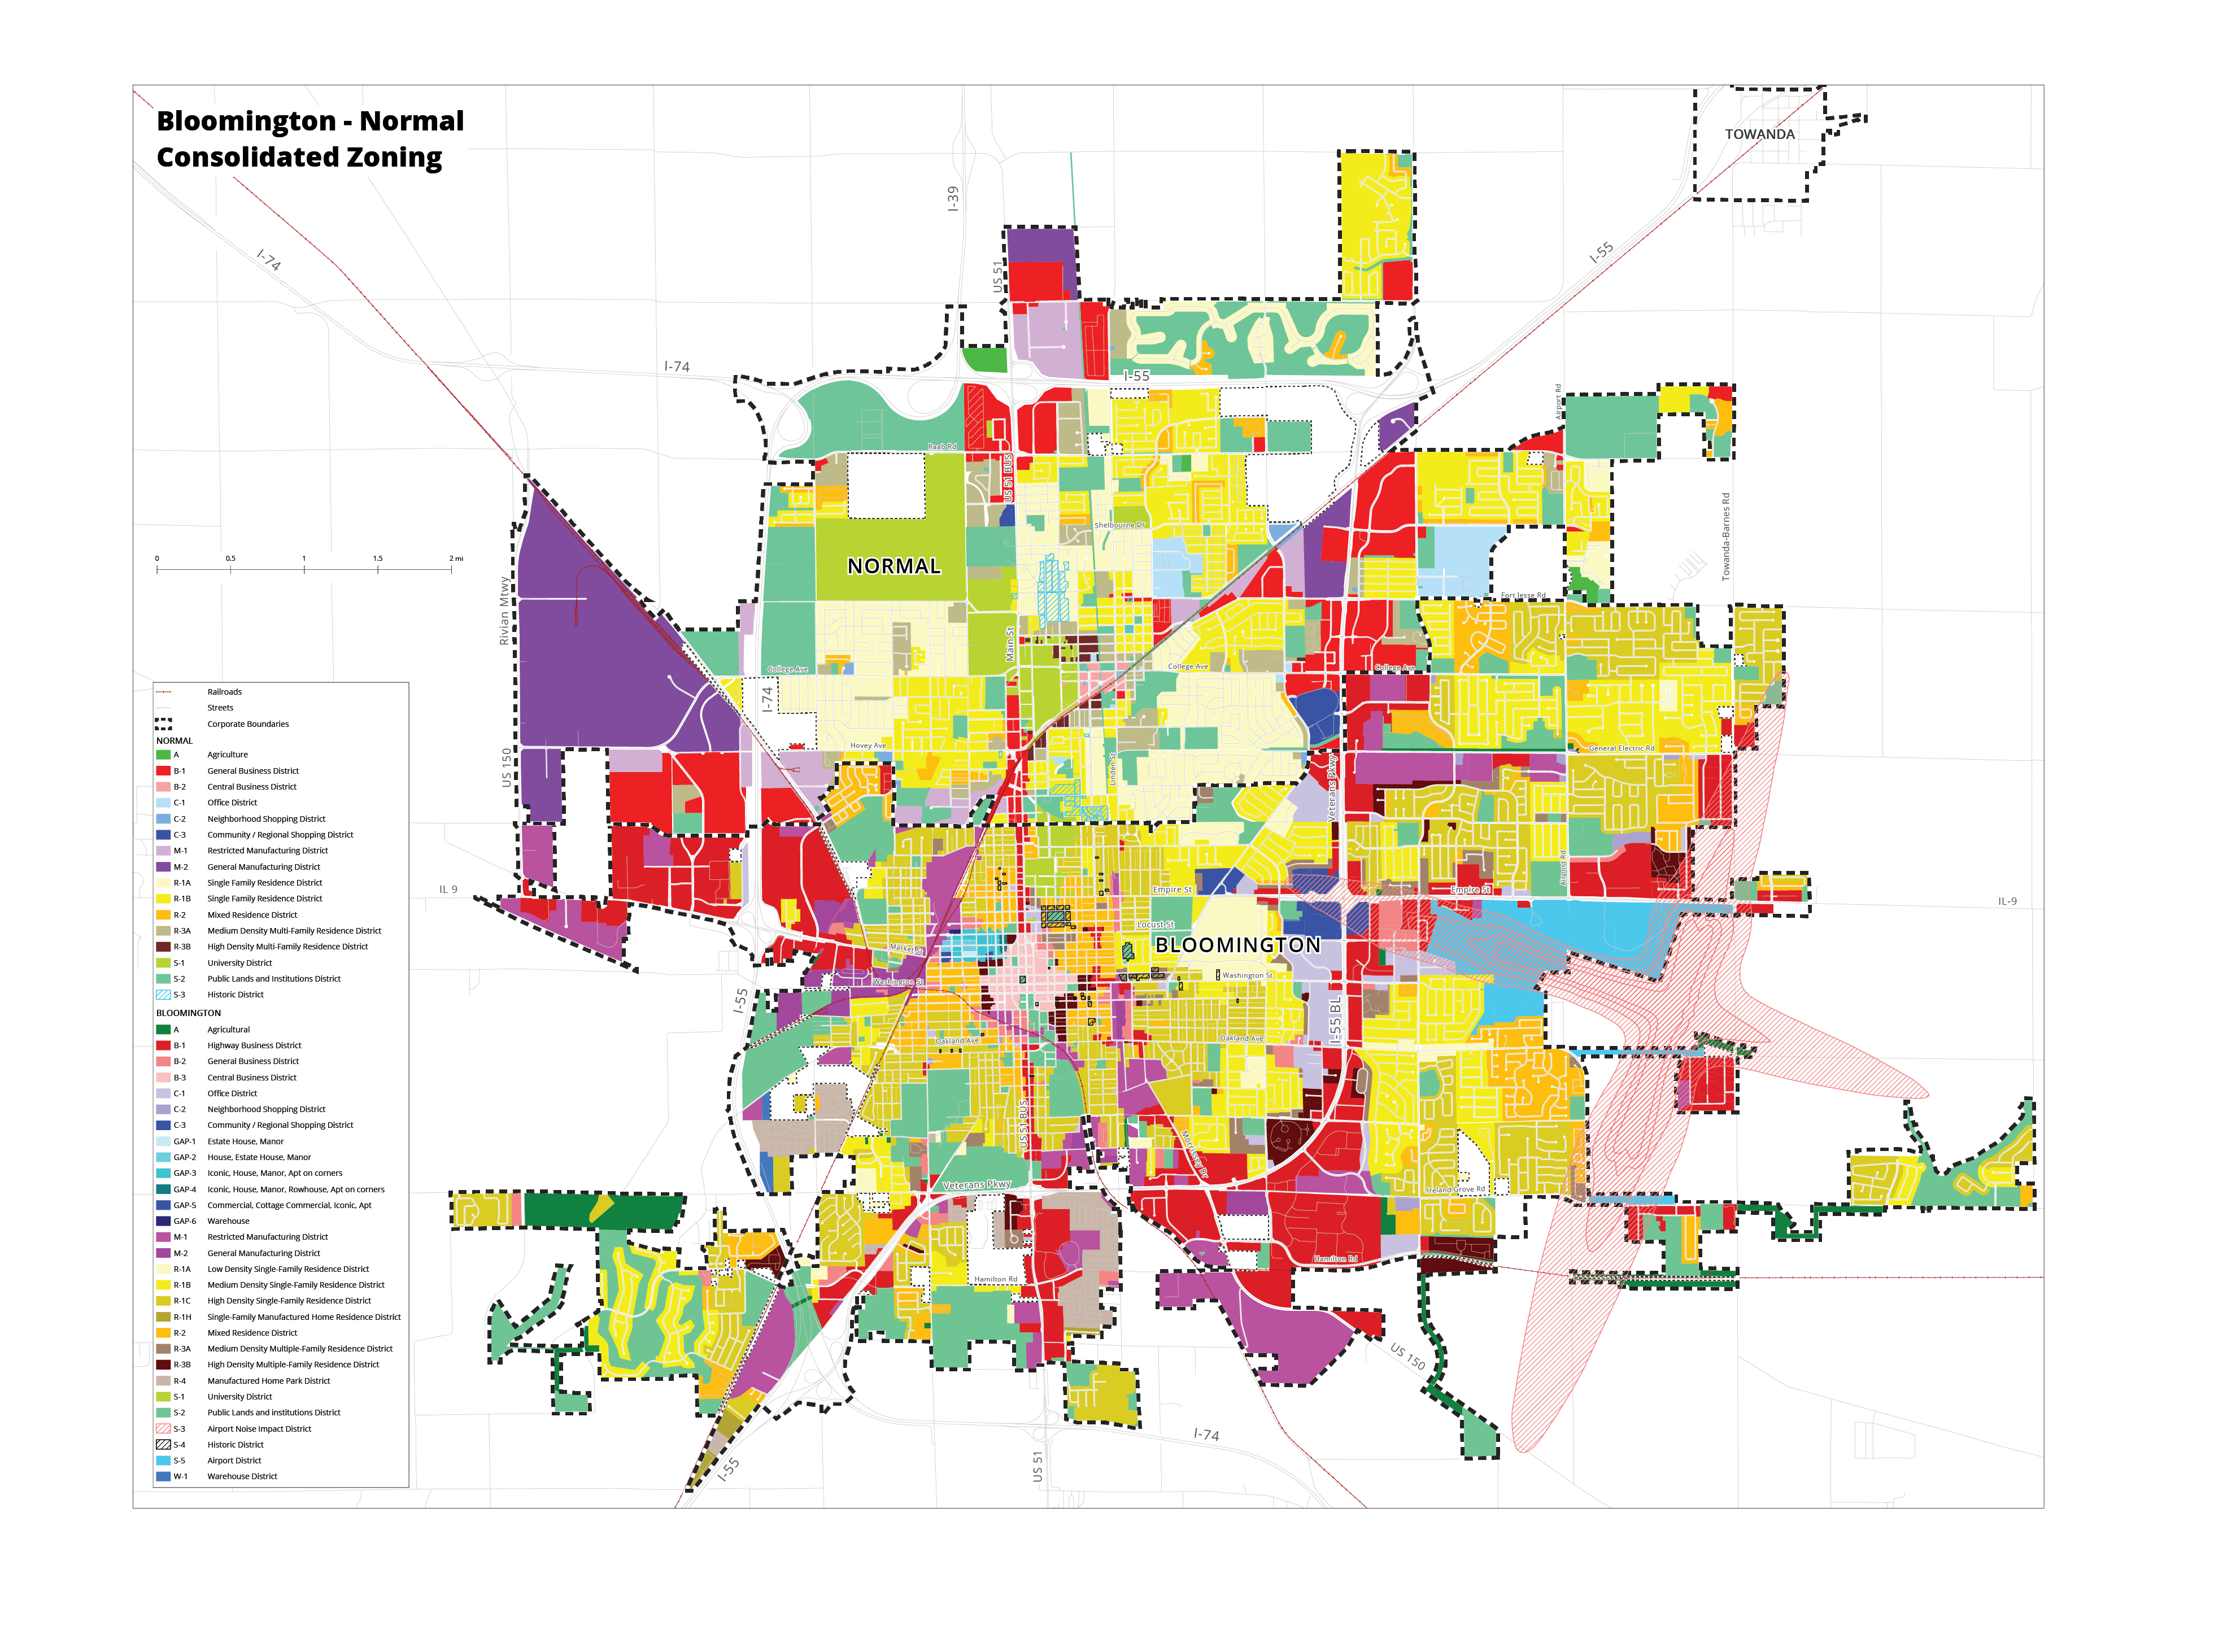
Bloomington-Normal Consolidated Zoning Map
Combined zoning map of Normal and Bloomington using McLean County GIS zoning data, drafted in ArcMap and finished using Adobe Illustrator.